News / QQQTrades.Club
The Turning?
The Turning?
June 26, 2023
Markets begin the "3 Point Turn"
If you have a drivers license, you have made a 3 Point turn. There are three points in market terms that I’m using. Lets take a look.
Yield Curve
This morning as I am writing this, the Yield Curve is at -1.02%. The last time the Yield Curve was at this point was March 7, 2023. What happened in March? Bank blowups. This low of a Y. C. is not good.
Skew
#SKEW is a measurement of Large Institutions hedging their portfolios from Tail end risk. Complicate I agree. It could be seeing as a forward looking indicator to what is to come in equity markets. Looking at the chart below, you can see that SKEW turns before the SP500 in this case.
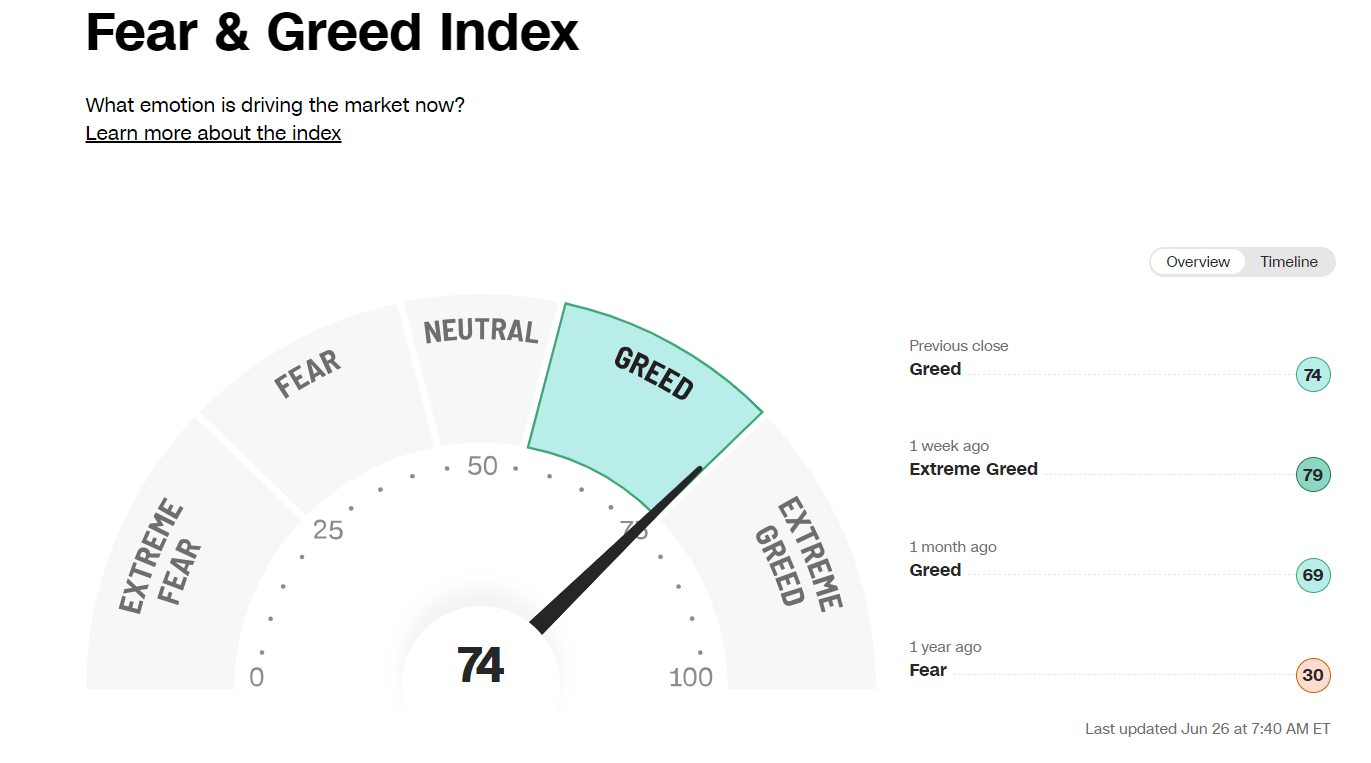
Greed Index
Not a scientific indicator, yet the Greed Index, this one being from CNN does give you a glimpse into how people are feeling about markets. Taking a #contrarian approach, this index is telling me that people have begun to let their guard down. Last week this index was in the Extreme Greed section. As the equity markets have sold off last week, the indicator has dropped.
Conclusion
I believe last week market the shortness of breath in the equity markets. Through in the short Russia Cue attempt that spooked oil prices and you have yourself a turning in markets. Look for extreme rates of change as we have seen in the SKEW index and sizeable ROC in the Yield Curve. Forward thinking is the approach.
Share this article:
More in QQQTrades.Club:
Ultra Clean Holdings (UCTT) July 25, 2024, Earnings Call Summary
Future Price Projections Participants: Rhonda Bennetto – Senior Vice President, Investor Relations Jim Scholhamer – Chief Executive Officer Sheri Savage...
The Turning?
July 26, 2024
APPLE, MICROSOFT, NVIDIA PRICE TARGET 🎯
Short term, price targets for the top three S&P 500 holdings
Short term, price targets for the top three S&P 500 holdings The following are my price targets for the very...

Trent Grinkmeyer
July 25, 2024
Nvidia's Stake in Serve Robotics: A Game-Changer for AI-Powered Delivery?
The tech world was buzzing last week when news broke that AI chip giant Nvidia owns a 10% stake in Serve Robotics, a company specializing in autonomous sidewalk delivery robots. This revelation sent Serve's stock soaring an impressive 233% over two days. But what does this mean for the future of AI-powered delivery, and should investors jump on board?
The tech world was buzzing last week when news broke that AI chip giant Nvidia owns a 10% stake in...

Trent Grinkmeyer
July 24, 2024
The Commercial Real Estate Crash
Its Ripple Effect on the Banking System and The Stock Market
The commercial real estate market is on the verge of a significant downturn, potentially mirroring the infamous 2008 financial crisis....
The Turning?
July 23, 2024
The Democratization of Compute
A Paradigm Shift in Business and Investment Artificial Intelligence (AI) is undeniably transformative, poised to revolutionize the world as we...

Kerry Grinkmeyer
July 23, 2024
Are Google and Meta Heading for a Stock Price Slump?
As an investor, it's crucial to keep a keen eye on market trends and potential shifts that could impact major players. Today, I want to discuss two tech giants that have long been darlings of Wall Street: Google and Meta. While they've enjoyed impressive growth and dominance in their respective fields, there are signs that their stock prices might face some headwinds in the near future.
As an investor, it's crucial to keep a keen eye on market trends and potential shifts that could impact major...

Trent Grinkmeyer
July 23, 2024


